Hello, Water Scientist!Workshop #1
Water Quality and Summary Statistics
Appalachian A. I. Corps @ UTK
Think about the water you drink. Where is it from? What do you know about it?
Lesson Objective
In this lesson, you will learn how to use the Python programming language to calculate summary statistics and investigate nitrates and nitrates in water samples.
Materials Needed:
- 💻 Your computer
- A web browser (Chrome, Firefox, or Safari)
- A calculator
Workshop Structure
Workshop Structure
💻 Navigate to: https://appalachianaicorps.org/ > Modules > Water Quality Monitoring > Lesson 1
Note: If you see a 💻 laptop 💻 icon in the slides, that means there is a corresponding activity in the module to complete!
Workshop Structure
You move pages by clicking on this left-hand sidebar
Let’s Get Started! 🔬💧
What is Python? 🐍
- What do you know about programming?
- Have you heard of a programming language?
- What do you think a programming language does?
💻 Let’s Try Python Right Now!
- Python will print text. In programming, we call text strings.
🎯 Checkpoint 1.a: Print Statements
💻 Let’s Try Python Right Now!
- Python will print text. In programming, we call text strings.
🎯 Checkpoint 1.a: Print Statements
Click the ▶️ Run Code button to run the block.
🎉 You just ran Python code! The output is right below the block! See how it printed Hello, Water Scientist!
Note that strings are always surrounded by quotation marks.
💻 Python Does Math!
- Python can do math problems way faster than we can!
🎯 Checkpoint 1.b: Mathematical Operators
Click the ▶️ Run Code button to run the blocks.
➕ Addition:
➖ Subtraction:
💻 Python Does Math!
- Python can do math problems way faster than we can!
🎯 Checkpoint 1.b: Mathematical Operators
Click the ▶️ Run Code button to run the blocks.
✖️ Multiplication:
➗ Division:
💻 Python Does Math!
🎯 Checkpoint 1.b: Mathematical Operators
Click the ▶️ Run Code button to run the blocks.
➕ Addition:
➖ Subtraction:
💻 Python Does Math!
🎯 Checkpoint 1.b: Mathematical Operators
Click the ▶️ Run Code button to run the blocks.
✖️ Multiplication:
➗ Division:
💻 Combining Math & Strings
- You can combine strings and math!
🎯 Checkpoint 1.d: Print Statements with Math
Click the ▶️ Run Code button to run the block.
Make a prediction. What will Python print?
💻 Your Own Print Statements
- Your turn! Edit the code in the block.
🎯 Checkpoint 1.e: Edit the print statements!
- Change “Student” to your first name.
Click the ▶️ Run Code button to run the block.
Intro to Water Quality
What is Water? 💧
- H2O is pure water!
- But water is almost always mixed with other things:
- minerals
- salts
- other chemicals
- But water is almost always mixed with other things:
- Some of these things help water be safe to drink, while others make it unsafe.
Water Quality 💧
Water Quality 💧
- How do we learn about water quality?
- What questions do you have about water quality?
- Why do we collect data about water?
Water Quality 💧
- Nitrogen can serve as both a nutrient and a pollutant.
🌳 Nitrogen as Nutrient
- Nitrogen is naturally occurring.
- When it combines with air and water, it forms ions: nitrates (NO3) and nitrites (NO2).
- Nitrogen within water is an important part of the nitrogen cycle, an important process necessary for life.
🌳 Nitrogen as Nutrient
🌳 Nitrogen as Nutrient
- Nitrogen is critical to life.
- As nitrogen cycles through the air and water, explain one way it is used by living organisms and how it is reintroduced into the cycle.
Nitrogen as Pollutant
- Too much nitrogen in water can be a pollutant.
- Excess nitrogen–in the form of nitrates and nitrites–can result from:
- Agricultural operations (fertilizer runoff and livestock manure)
- Sewage and septic systems (human waste)
- Acid rain
Nitrogen as Pollutant
Nitrogen as Pollutant
- This video shows excess fertilizer use can contribute to nitrogen as a pollutant in water.
- What other processes can you recall also contribute to nitrogen as a pollutant?
Monitoring Nitrogen: Your Utility 💧
- The U.S. Environmental Protection Agency (EPA) sets limits on allowable concentrations of nitrates and nitrites in drinking water.
Nitrate and Nitrite EPA Limits
Nitrates: 10 mg/L
Nitrites: 1 mg/L
🧠 Using data from EWG, what is the most recently reported nitrate concentration by your water utility? Are your’s over the limit?
Monitoring Nitrogen: YOU! 🔬💧
We can also monitor our own water for nitrogen!
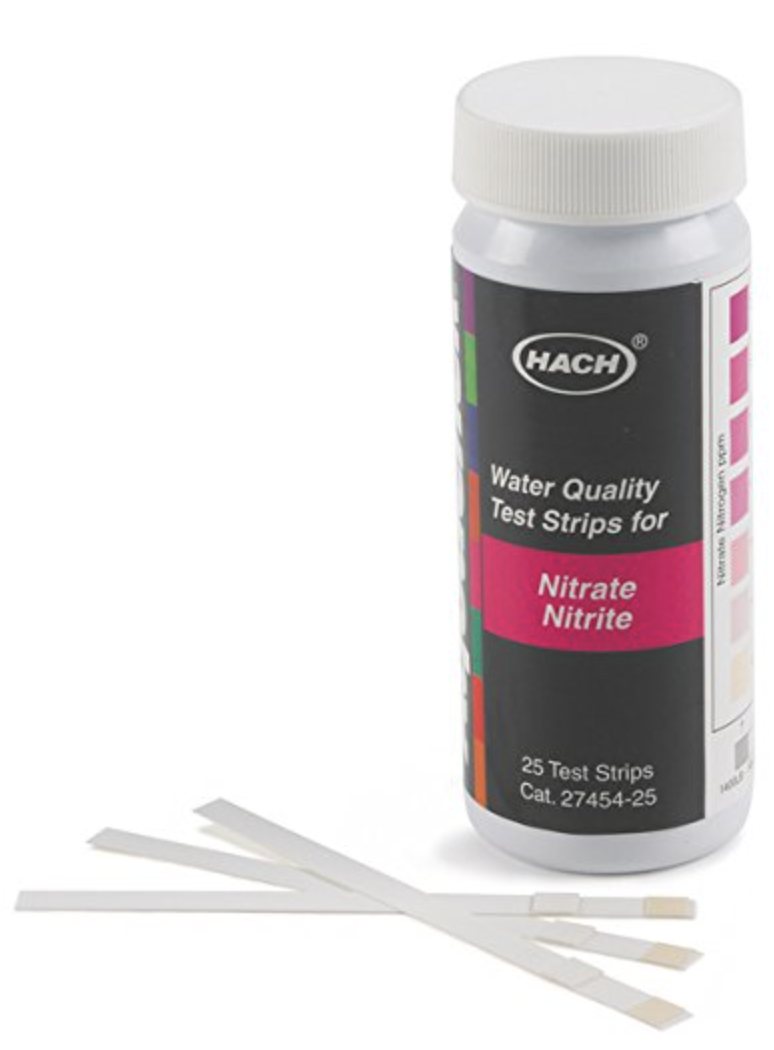
Nitrate Lab
🧑🏽🔬👨🏻🔬👩🏼🔬
Nitrate Lab: Roles
Assign roles to each person in your group:
Role 1: Data Recorder (Lab Report)
- 1 lab handout
- pencil
Role 2: Data Recorder (Computer)
- computer (everyone else can put theirs away temporarily)
- submission form pulled up in browser
Role 3: Lab Technician
- water samples
- test strips
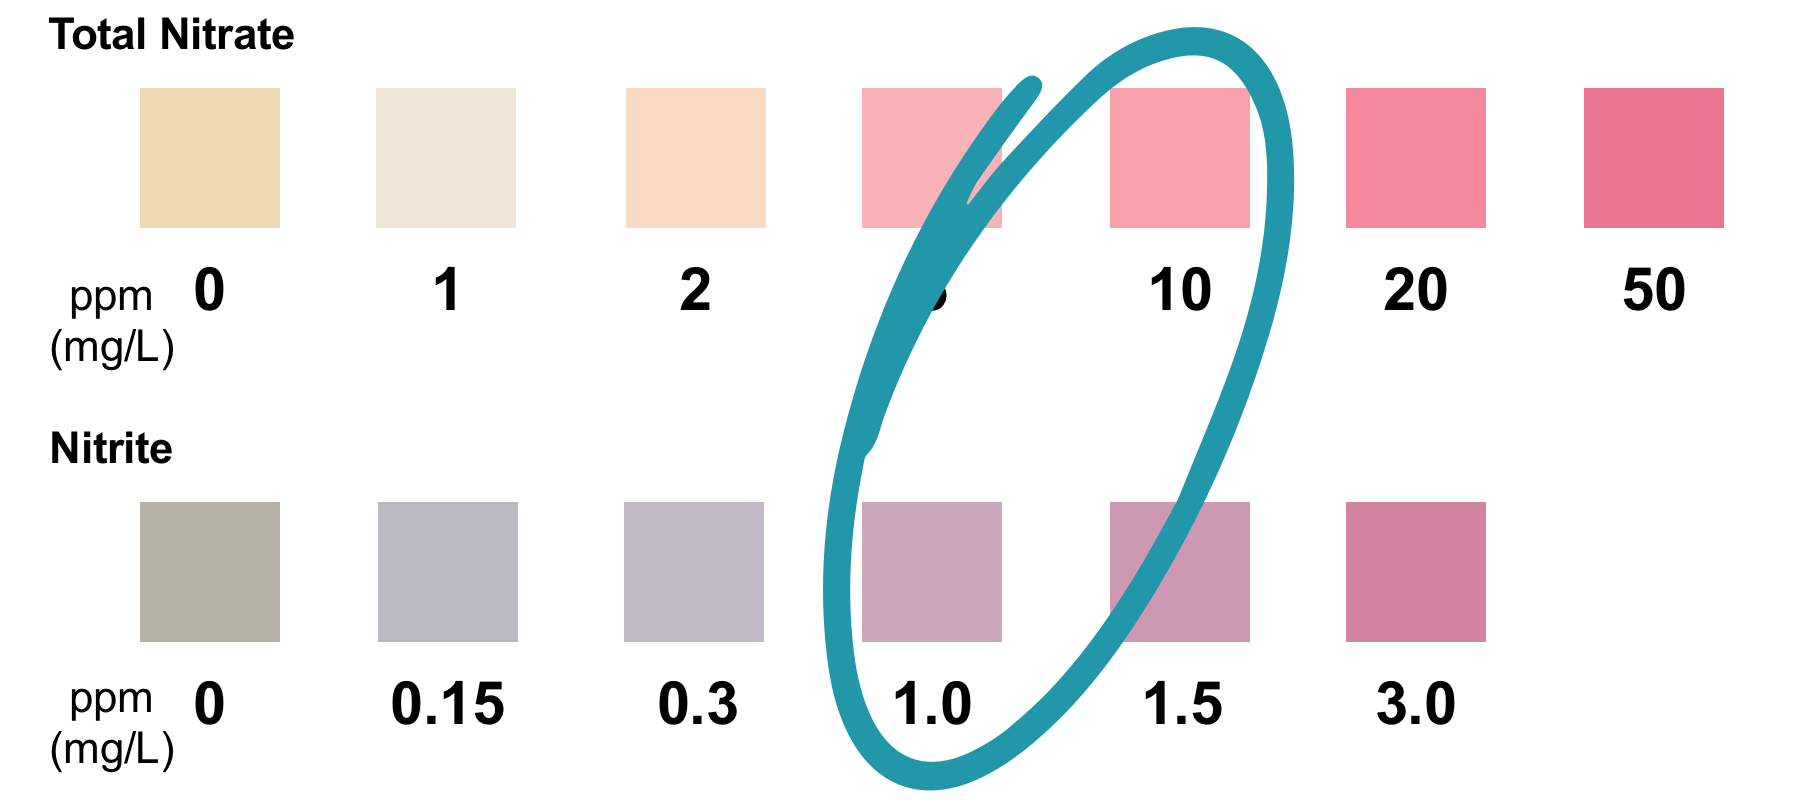
Nitrate Lab: Procedure
Read the procedure on your lab sheet. Make sure everyone in your group understands the procedure and has the materials needed for their role.
🚀 LET’S BEGIN 🚀
When finished: With the help of the Data Recorder (Lab Report), make sure everyone in your group has a copy of the data table on their own sheet.
Intro to Statistics
What is Statistics?
- How can we make sense of the data we just collected during the nitrates lab?
- We can use statistics!
- We can use statistics!
- What do you know about statistics?
Measures of Center
We use measures of center to find the central value of a group of numbers.
Sample Dataset: 1, 2, 6, 5, 1
Mean
The mean is often called the “average”.
\(\Large \frac{1 + 2 + 6 + 5 + 1}{5} = 3\)
The mean value of this sample dataset is 3.
Measures of Center
We use measures of center to find the central value of a group of numbers.
Sample Dataset: 1, 2, 6, 5, 1
Median
The median is a different kind of measure of center.
\(\large 1, 1, 2, 5, 6\)
![]()
Statistics: Your Turn
🎯 Checkpoint 4.a: Calculations—Mean & Median
Find the mean and median of your team’s lab data:
✏️ Record your results on your lab sheet.
🐍 Python: Lists!
🐍 Python: Lists!
Sample Dataset: 1, 2, 6, 5, 1
Lists
In Python, we store multiple numbers in something called a list.
💻 Python: Make Your Own Lists!
🎯 Checkpoint 5.a: Storing data as lists!
Replace the ??, ??, ??, and ?? placeholders with the nitrate and nitrite readings from your group!
Click the ▶️ Run Code button to run the block.
My group's nitrate readings: [10, 20, 30, 40]
My group's nitrite readings: [10, 20, 30, 40]
💻 Python: Make Your Own Lists!
🎯 Checkpoint 5.b: Basic functions with lists.
len()
How many items are in a list?
min()
Smallest number in a list.
max()
Biggest number in a list.
💻 Python: Make Your Own Lists!
Sample Datasets: A = [1, 2, 6, 5, 1]
len()
How many items are in a list?
Number of samples tested: 5
Lowest nitrate: 1
💻 Python: Make Your Own Lists!
Sample Datasets: A = [1, 2, 6, 5, 1]
Highest nitrate: 6
Center & Spread
Python: Measures of Center
- We can also use Python to calculate measures of center.
Mean
💻 Python: Measures of Center
Mean: Your Turn!
🎯 Checkpoint 6.a: Calculating group mean nitrate.
Replace the 10, 20, 30, and 40 placeholders with the nitrate readings from your group!
Click the ▶️ Run Code button to run the block.
On average, do you think your water is safe in terms of nitrate and nitrite concentrations? Why or why not?
Class Data
- Python can handle large amounts of data with ease!
- We can consider the nitrate and nitrite data your whole class collected.
- To do that, paste the .csv link from your teacher in the code to import the Google Form data.
Your teacher will provide the link to the CSV file for you to use.
💻 Class Data
🎯 Checkpoint 6.b: Import class data.
Replace the placeholder (Line 4) with CSV URL from your teacher. Be sure the keep the quotation marks! This will pull the class nitrate and nitrite data from the CSV file so you can use it later down the page.
Click the ▶️ Run Code button to run the block.
💻 Class Data
Nitrate values: [0.5, 1.0, 1.5, 2.0, 2.5, 3.0, 3.5, 4.0, 4.5, 5.0, 5.5, 6.0, 6.5, 7.0, 7.5, 8.0, 9.0, 10.0, 10.5, 11.0, 12.0, 13.5, 15.0, 18.0, 22.5]
Nitrite values: [0.0, 0.0, 0.1, 0.1, 0.15, 0.2, 0.2, 0.25, 0.3, 0.3, 0.35, 0.4, 0.4, 0.5, 0.5, 0.6, 0.7, 0.8, 0.9, 1.0, 1.2, 1.5, 1.8, 2.5, 3.0]
💻 Class Data: Mean
🎯 Checkpoint 6.c: Calculate means for class data.
Replace the ??? placeholders (Lines 3 & 4) with the variables that hold the class nitrate and nitrite data. That is, class_nitrate and class_nitrite, respectively.
Click the ▶️ Run Code button to run the block.
💻 Class Data: Mean
🎯 Checkpoint 6.c: Calculate means for class data.
Replace the ??? placeholders (Lines 3 & 4) with the variables that hold the class nitrate and nitrite data. That is, class_nitrate and class_nitrite, respectively.
Click the ▶️ Run Code button to run the block.
7.58
0.71
Your answers will differ. This is example data.
💻 Class Data: Median
🎯 Checkpoint 6.d: Calculate medians for class data.
Similarly, replace ??? with the correct variable names to calculate the median for the class nitrate and nitrite data.
Click the ▶️ Run Code button to run the block.
💻 Class Data: Median
🎯 Checkpoint 6.d: Calculate medians for class data.
Similarly, replace ??? with the correct variable names to calculate the median for the class nitrate and nitrite data.
Click the ▶️ Run Code button to run the block.
6.5
0.4
Your answers will differ. This is example data.
Python: Measures of Spread
- Spread is a second type of statistical measure.
- Like it sounds, it tells us how spread out our data are.
Range
max() - min()
💻 Class Data: Range
Range: Your Turn!
🎯 Checkpoint 6.e: Calculate ranges for class data.
Replace ??? with the correct variable names to calculate the ranges of the data.
Click the ▶️ Run Code button to run the block.
💻 Class Data: Range
Range: Your Turn!
🎯 Checkpoint 6.e: Calculate ranges for class data.
Replace ??? with the correct variable names to calculate the ranges of the data.
Click the ▶️ Run Code button to run the block.
22.0
3.0
Your answers will differ. This is example data.
Class Data: Standard Deviation
Standard Deviation
- The standard deviation is another measure of spread.
- It tell us the average distance the data in the dataset is from the mean.
💻 Class Data: Standard Deviation
Standard Deviation: Your Turn!
🎯 Checkpoint 6.f: Calculate standard deviations for class data.
Replace ??? with the correct variable names to calculate the standard deviations of the data.
Click the ▶️ Run Code button to run the block.
💻 Class Data: Standard Deviation
Standard Deviation: Your Turn!
🎯 Checkpoint 6.f: Calculate standard deviations for class data.
Replace ??? with the correct variable names to calculate the standard deviations of the data.
Click the ▶️ Run Code button to run the block.
5.4
0.8
Your answers will differ. This is example data.
Boxplots & Outliers
💻 Class Data
Whew! That was a lot of work. Wouldn’t it be great if Python could do it for us? Good news. It can! But first, let’s re-import our data on this page.
🎯 Checkpoint 8.a: Import Class Data.
Once more, replace the placeholder (Line 4) with CSV URL from your teacher. Be sure the keep the quotation marks! This will pull the class nitrate and nitrite data from the CSV file so you can use it later down the page.
Click the ▶️ Run Code button to run the block.
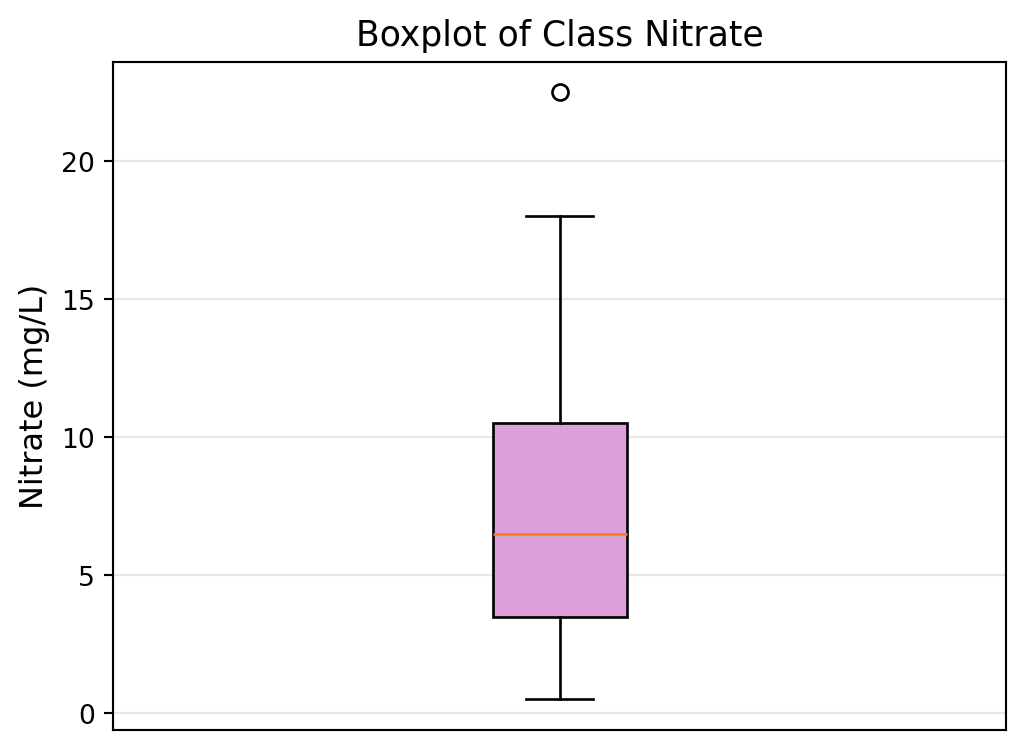
💻 Class Data: Boxplots
🎯 Checkpoint 8.b: Create a boxplot for the class nitrate data.
Click the ▶️ Run Code button to run the block and create a boxplot for the class nitrate data.
import matplotlib.pyplot as plt

plt.figure(figsize=(6, 6))
plt.boxplot(class_nitrate, vert=True, patch_artist=True,
            boxprops=dict(facecolor='plum'))
plt.ylabel('Nitrate (mg/L)', fontsize=12)
plt.xticks([])
plt.title('Boxplot of Class Nitrate', fontsize=13)
plt.grid(True, alpha=0.3, axis='y')
plt.show()
This uses example data.
💻 Class Data: Boxplots
Now, let’s create a boxplot for the class nitrite data.
🎯 Checkpoint 8.c: Create a boxplot for the class nitrite data.
Click the ▶️ Run Code button to run the block and create a boxplot for the class nitrite data.
💻 Class Data: Boxplots
Now, let’s create a boxplot for the class nitrite data.
🎯 Checkpoint 8.c: Create a boxplot for the class nitrite data.
Click the ▶️ Run Code button to run the block and create a boxplot for the class nitrite data.
This uses example data.
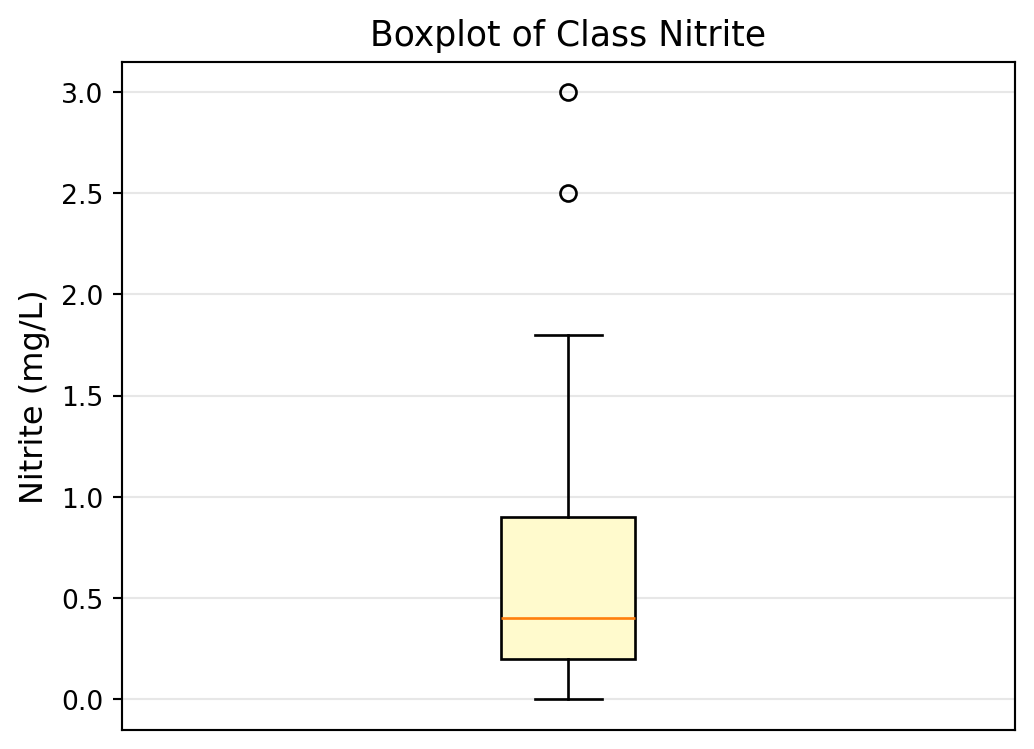
Outliers
Outliers are data points that are very different from the rest of your data.
- Can really change your statistics—like mean and standard deviation.
- On boxplots, outliers are represented by a circle (or sometimes a star) beyond the whiskers.
🧠 Do either the class nitrate or nitrite boxplot have outliers? How do you know?
Why Do Outliers Happen?
Outliers can happen for different reasons:
- Buoy Malfunction 🔧
- Real Pollution Event 🚨
- Factory dumped chemicals into the stream
- Farm fertilizer washed in after a storm
- Sewage spill
- Natural Event 🌧️
- Heavy rain changed water chemistry
- Algae bloom
- Seasonal variation
- Heavy rain changed water chemistry
Your job as a scientist: Figure out which reason it is!
🎟️
Exit Ticket
🎟️ Exit Ticket
Share what you’ve learned on the Exit Ticket.
🧠
Exercises
🧠 Exercises
Try the Exercises.
AAIC — Water Quality