Facilitator’s Guide:
Water Quality and Summary Statistics
Lesson Topics and Standards
- Water quality
- Nitrates
- Nitrites
- Nitrates
- Introduction to Python programming
- Summary statistics:
- Measures of center:
- Mean
- Median
- Mean
- Measures of spread:
- Standard deviation
- Range
- Standard deviation
- Outliers
- Measures of center:
- Data visualization:
- Boxplots
- BIO1.LS2.1/ECO.LS2.13/EVSC.LS2.3: Use mathematical and/or computational representations to support explanations of factors that affect the carrying capacity of ecosystems at different scales.
- SCRE.ETS2.3: Identify the most appropriate scientific instruments and/or computer programs for different experiments and research, and learn to use, care for, and maintain them, gather data, and analyze results.
- PSCI.PS1.7: Develop, or use, a model to predict or explain a phenomenon by using appropriate indicators.
- SCRE.ETS3: Applications of Science: Select and use appropriate data tables, graphs, and diagrams to represent data. Use mathematics and computational thinking to look for patterns in data.
- SCRE.ETS3: Applications of Science: Select and use appropriate statistical procedures (descriptive statistics, t-tests, regression and correlation, chi-square, etc.) to analyze data.
- A1.S.ID.A.1: Use measures of center to solve real-world and mathematical problems.
- A1.S.ID.A.3: Interpret differences in shape, center, and spread in the context of the data sets, accounting for possible effects of extreme data points.
- AGSCIENCE 3.3: Biodiversity: Evaluate the impact of habitat fragmentation, destruction, and other environmental pressures, such as invasive species, overharvesting, pollution, and climate change on local and global biodiversity (genetic, species, and ecosystems.) Distinguish between types of pollution (point and nonpoint sources) and their sources to predict the effects on environmental conditions (e.g., water, soil, and air), animal populations, and plant populations from various kinds of human activity.
Lesson Overview Video Tour
If you would like a more in-depth overview of the lesson, please consult the slides with visible facilitator notes.
Slide Deck for Lesson
Student Handout
You can make a copy of the student handout for this lesson.
If you would like to provide students a copy of the slides with spaces for note taking, we have prepared a handout for this purpose.
Lesson Prep
1. Prepare Materials for Nitrates Lab
We suggest creating water samples the for nitrates lab the day before. This will allow the nitrates to fully dissolve in the water.
Materials needed:
- Miracle-Gro Fertilizer Liquid
- Dropper/Pipette
- Small cups for student use (to hold samples for testing)
- Small sticky notes (we use the 1.875” stickies) grouped into sets of 1 red, 1 green, 1 blue, 1 yellow, etc.
- Each group will be assigned a color (red, green, blue, yellow, etc.), so the number of stickies in a set will be dictated by the number of groups.
- Each group will need one multi-colored sticky set per water sample.
- Each group will be assigned a color (red, green, blue, yellow, etc.), so the number of stickies in a set will be dictated by the number of groups.
- 1 Sharpie/Poster marker per group
- Nitrate/Nitrate test strips
- Masking tape/ sharpies to label cups/samples
Mixing Guide
This plan is written to provide samples for 5 groups with 4 samples each.
For 5 groups × 4 samples = 20 total samples
Fill each cup with 1 cup (8 oz) water, then add liquid fertilizer drops with dropper/pipette:
Normal/Low Range (8 samples) - 0-5 ppm
4 samples: Plain water (0 drops)
4 samples: 1-2 drops per cup
Moderate Range (6 samples) - 8-12 ppm
6 samples: 4-6 drops per cup
Medium-High Range (3 samples) - 15-20 ppm
3 samples: 8-10 drops per cup
Extreme Outliers (3 samples) - 35-50 ppm
2 samples: 20-25 drops per cup (~35-40 ppm)
1 sample: 30+ drops per cup (50 ppm, maxes out strip)
2. Prepare Materials for Boxplot Activity
Materials needed:
- 1 Post-It Gridded Sticky Page/Group
- We pre-drew the axis on the page due to time limitations
- We pre-drew the axis on the page due to time limitations
- 1 poster marker per group
3. Make Copies: 1 Handout Per Student
- You will need to make 1 copy per student of the workshop handout. If color-copying is not possible, make sure to have a reference of the color key for the nitrate/nitrite test strips available for each group. Note that the keys vary depending on the brand of test strips you purchase, so you may need to modify the handout to match the specific test strips you are using. Also, the colors are sensitive to lighting and printer setup, so if may be preferrable to have several bottles available for comparison to the orginal key on the bottle itself.
4. Create and Share Link for Nitrates Lab Data Collection
- Make sure you are logged into your school Google Account
- Use this link to make a copy of the Nitrate/Nitrite Lab Google Form
- Open your copy of the Nitrate/Nitrite Lab Google Form. Publish the form. Double check the sharing settings to make sure all of your students can respond.

- While on the sharing settings, copy the respondent link and be prepared to share this link with your students, probably via email or your LMS. Close the sharing settings.
- On the “Responses” tab, click “Link to Sheet” > “Create a New Sheet” to aggregate all of the student responses into one spreadsheet.
- Open the spreadsheet it generates (it may automatically open) and go to “File” > “Share” > “Publish to web” and use the following options:
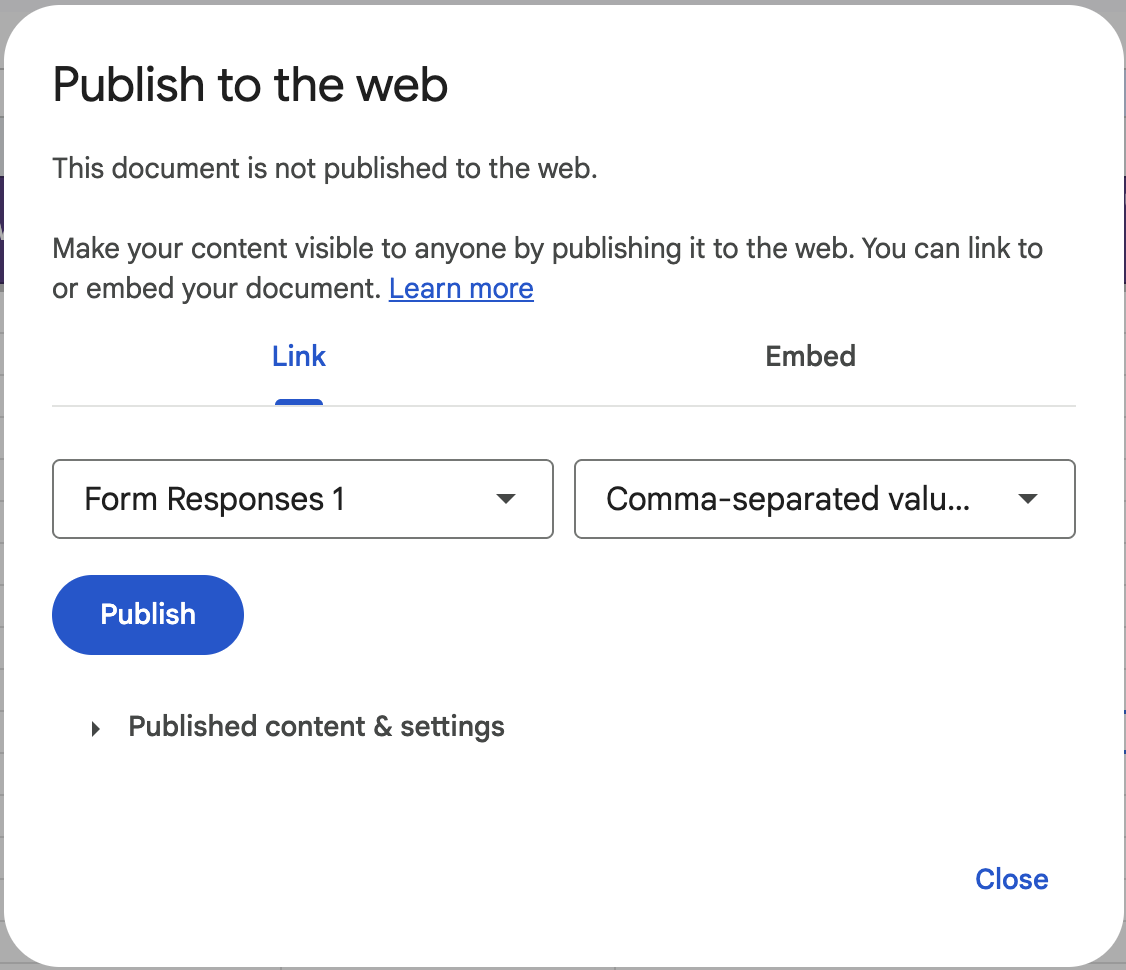
- When you click publish, it will give you a link. Please be prepared to share this link with your students during the second half of class… perhaps via email or via LMS. They will need to copy/paste it to access the data. You can set this up well in advance of class.
- Note: If you are facilitating this module for more than one class, you will want to repeat this process once for each class, so that each class has their own submission form and spreadsheet.
- This can be done well in advance, just make sure to keep the form link (respondent link) and spreadsheet link (publish to web link) for each class ready to disseminate.
5. Create group tents using colored paper that matches the sticky notes.
6. Create copy of exit ticket for end-of-lesson implementation.
- We have drafted a three-question exit ticket that aligns with the three major content areas of this lesson (Water Quality, Python, and Statistics). We are providing the Google Form here if you would like to use it or modify it for your own needs.
7. Create copy of the exercise for after-lesson practice.
- We have also created a Google Colab exercise that you can use with students to practice the concepts covered in this lesson. It is available here.
Lesson Overview & Takeaways
By the end of the lesson, students will be able to:
- Write and run a basic python script that includes:
- strings
- mathematical operators
- statistics functions
- print statements
- lists
- strings
- Explain, at a high level, the role of nitrogen in water quality evaluations
- Carry out procedures to collect and interpret data concerning nitrate and nirite concentrations from a water quality test
- Construct boxplots, manually and computationally, to visualize water quality data
Reference Materials
Whole-Class Video Links:
- Water Quality
- Nitrogen Cycle
- Nitrogen as Polutant
- What is Statistics?
- Mean, Median & Mode