Regression
This module is designed to be used in conjunction with the Lesson 3 slide deck and other resources located in the facilitator’s guide.
Lesson Objective: In this lesson, you will learn how to use scatterplots and regression lines in Python to predict nitrate levels from RGB color values on test strips.
Materials Needed:
- A computer with a webcam
- A web browser (Chrome, Firefox, or Safari)
Checkpoints on this Page:
🔬💧 Welcome Back, Scientists!
- Let’s remember what we learned during workshop #2:
- AI: Classification
- Model Accuracy
- Agricultural Uses of Classification
- Data Ownership
- Computers & Color
- AI: Classification
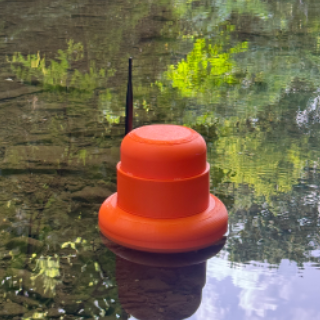
Remember Me, Smokey Buoy!?
We met Smokey Buoy last workshop and learned a bit about how it works.
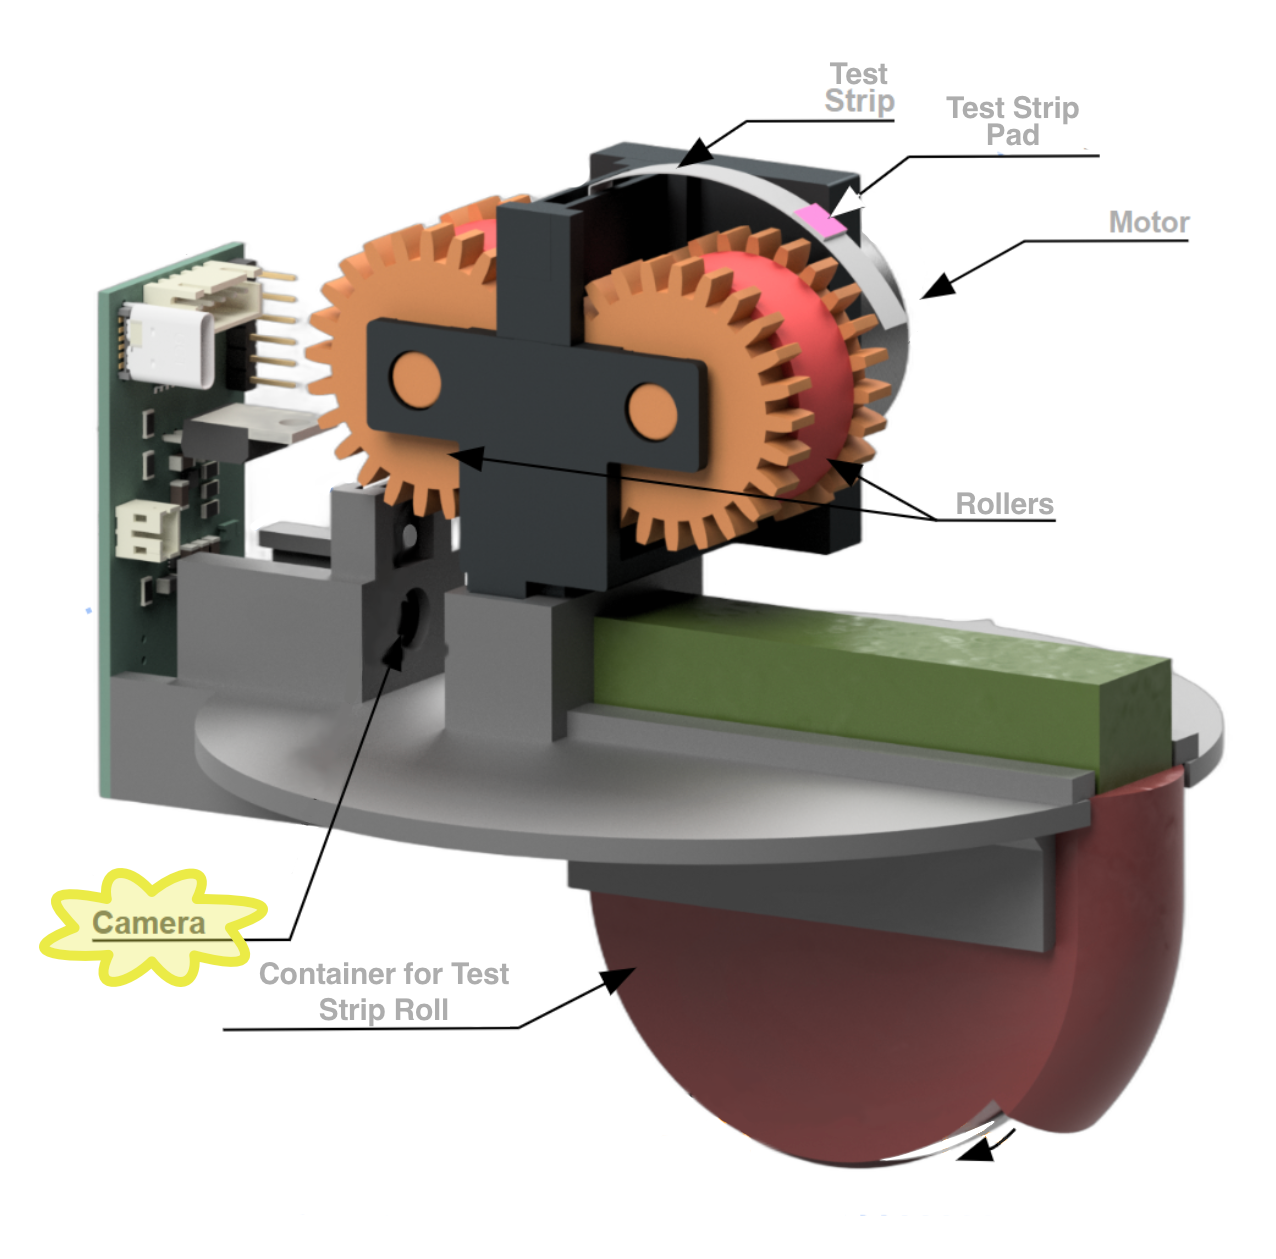
Smokey Buoy: Components
Let’s recall Smokey’s components and how they work together:
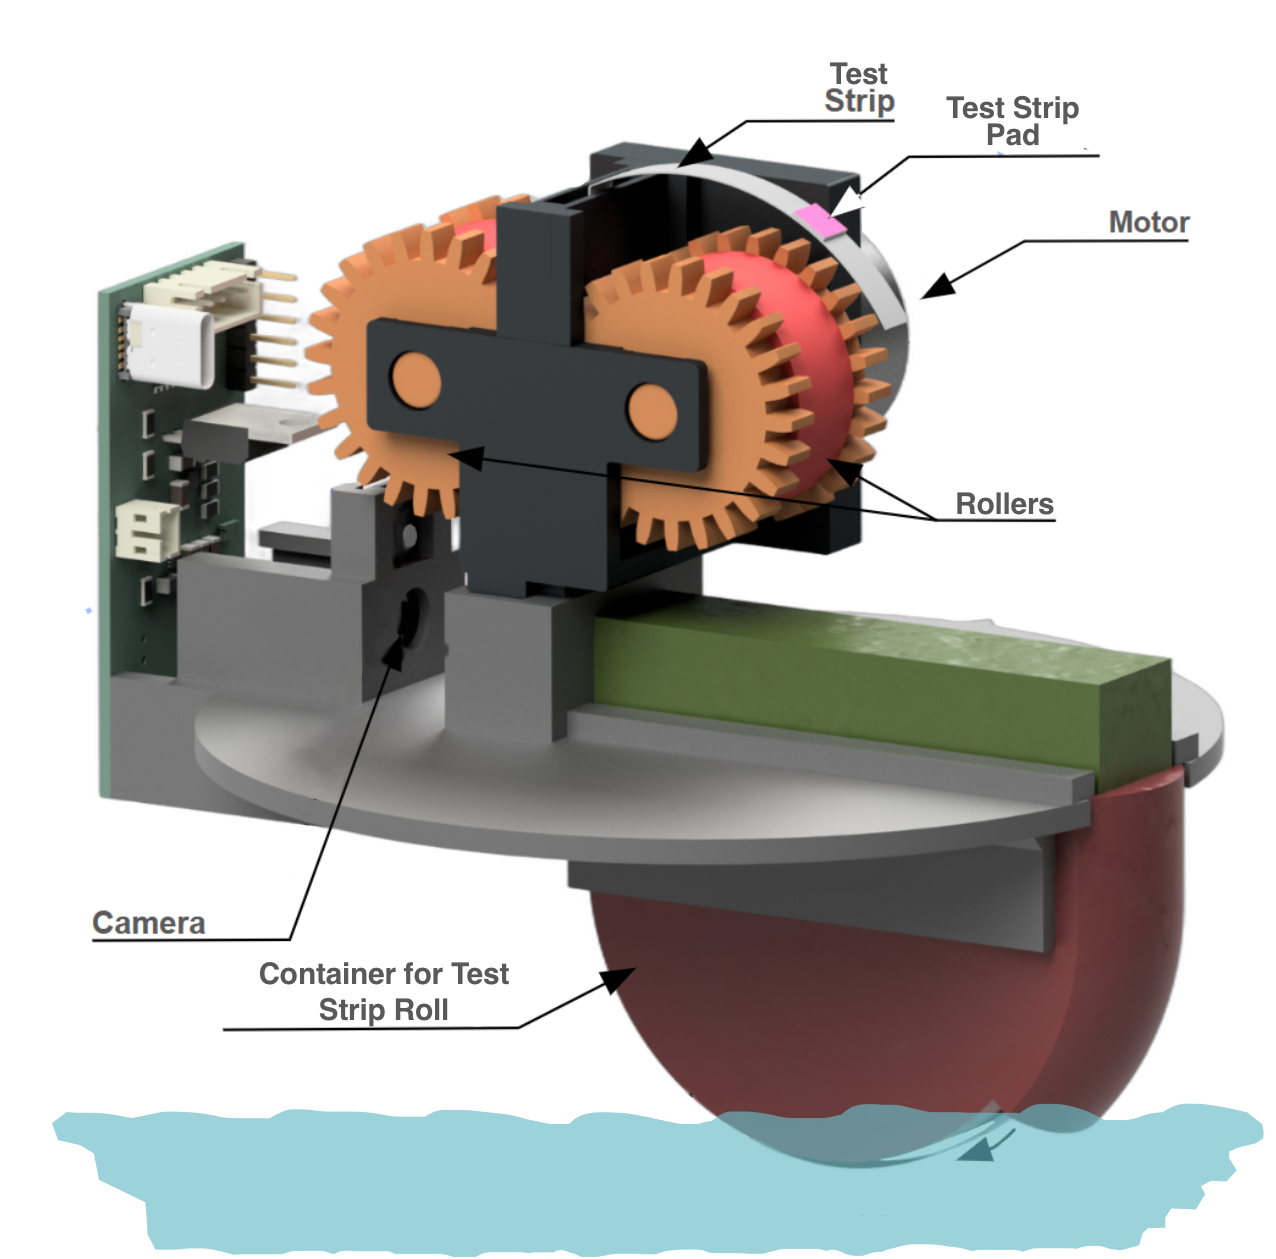
Smokey Buoy: 🎥 Camera
- Specifically, Smokey Buoy’s camera has two jobs:
- Watch for a test pad
- We talked about this last workshop!
- When pad is present, take a picture
- We’ll discuss what happens with the picture today!
- Watch for a test pad